Abstract
To help meet its near-term NDC goals and long-term net-zero 2070 target, the Government of India has planned to establish a Carbon Credit Trading Scheme (CCTS), i.e., a domestic emission trading scheme (ETS). An ETS is an inherently cost-effective policy instrument for emission reduction, providing the greatest flexibility to reduce emissions from within and across sectors. An effective ETS requires design features that consider country-specific challenges and reflect its role within the larger policy package to achieve long-term emission reduction. Within the Indian context and in this study, we therefore investigate—(i) what might be the role of the ETS in achieving India’s long-term mitigation targets? (ii) How might the various sectors interact under an emissions cap? (iii) How might the ETS interact with existing energy and climate policies? We do this analysis by running four main scenarios using the integrated assessment model GCAM (v6.0), adapted to India-specific assumptions and expectations. These scenarios are—(i) NZ (net-zero), (ii) NZ+ ETS, (iii) NZ+ CC (command and control), and (iv) NZ+ RPO (renewables purchase obligations)+ ETS. The NZ scenario assumes India’s near-term and long-term climate commitments of net zero by 2070. Scenarios with ETS (ii) and (iv) apply an emissions cap on four sectors—electricity, iron and steel, cement, and fertilizer. The scenario with CC applies a homogenous emission cap on each of the chosen sectors but does not allow cross-sectoral trading. The last scenario includes renewables purchase obligations (RPOs) along with an ETS. We show that under a specific ETS emissions cap: (i) the electricity sector emerges as the largest source of cost-effective greenhouse gas (GHG) reduction options; (ii) ETS with trading across sectors is around 24% more cost-effective than ETS with trading only within sectors, (iii) RPOs can be complementary to an ETS although the impact of RPOs on GHG reductions in the electricity sector would need to be considered when setting the level of the ETS cap (or emissions intensity targets) or the RPO targets to avoid low carbon prices, and (iv) the direction and volume of financial transfers across sectors depends on allocation targets set by the government. Based on these results, we provide design recommendations for India’s ETS.
1. Introduction
As part of its commitment to the goals of the Paris Agreement, India committed to reducing emissions intensity of its gross domestic product (GDP) by 45% by the year 2030 relative to 2005 levels, and increasing the target for the share of non-fossil capacity from 40% to 50% in 2030 (Press Information Bureau 2022). Along with this, India also announced a long-term target of reducing emissions to net-zero in 2070 (Press Information Bureau 2022).
To achieve its stated decarbonization targets, India has already deployed a slew of energy fiscal and non-fiscal policies across sectors. These include promoting renewable energy generation in power especially through renewable purchase obligations (RPOs), policies in other energy-intensive industrial sectors aimed at enhancing energy efficiency, supporting uptake of electric vehicles, incentivizing hydrogen production, and reducing energy demand in buildings (for a detailed list refer to SI section S1).
In December 2022, an amendment to the Energy Conservation Act, 2001 passed both houses of parliament, introducing a significant addition to existing climate policies—a domestic emission trading system (ETS) named the Carbon Credit Trading Scheme (CCTS) (Press Information Bureau 2023). CCTS will be part of the wider Indian Carbon Market, which also includes a voluntary domestic offset market for non-obligated entities. The larger objective of the CCTS is to decarbonize the Indian economy by pricing carbon and mobilizing finance for decarbonization (Press Information Bureau 2023). For the CCTS, the period from 2023 to 2025 will serve as a transition period for obligated entities to move from the perform, achieve, and trade (PAT) scheme, where they were given energy efficiency targets, to the CCTS, where entities will be given a greenhouse gas (GHG) emissions intensity target (tCO2e/t product) (Singh and Chaturvedi 2023).
Carbon pricing is a policy instrument that aims to reduce carbon emissions by placing a cost on carbon. Carbon pricing can be through a carbon tax, an ETS, or a mixture of the two (hybrid policy). An ETS can either place an absolute cap on the total volume of GHG emissions produced by one or more economic sectors in a jurisdiction (examples include the EU ETS, Korea ETS, California Cap-and-Trade System), or it can be an output-based cap using emission intensity targets (i.e., emissions per unit of electricity generated or product, such as in the China and Indonesia ETSs and the Indian CCTS). Depending on the overall cap-setting approach, the entities in the covered sectors are allotted emission allowances, either through free allocation (or setting emissions intensity benchmarks), or auctions conducted by the regulator, or a combination of both. Depending upon their ability and the costs of reducing emissions, entities can then trade emission allowances. Entities with emission intensities lower than a predefined benchmark can sell allowances to entities with higher emission intensities. This results in a process of price discovery per tonne of carbon.
In most countries around the world, carbon pricing exists alongside other climate and energy policies to form a policy package. This is because carbon policies alone cannot solve various institutional, political, and regulatory barriers to decarbonization (Jaffe et al 2005, Twomey 2012, Bertram et al 2015, Klenert et al 2018, Mehling and Tvinnereim 2018, Patt and Lilliestam 2018, Rosenbloom et al 2020). Thus, although policies co-exist together because of different policy objectives, the interconnected nature of energy flows and sectoral overlap of policies means that it is critical to understand the interaction between carbon pricing and other non-market energy policies. Poor policy integration could have negative consequences in the form of higher costs to society and increased risk of stranded assets (Hood 2013, Iyer et al 2015, Binsted et al 2020). Therefore, consideration needs to be given to an optimal mix of policies that ease both price and non-price related barriers to decarbonization and the impact of other policies on GHG emission reduction when setting the emission reduction targets of an ETS.
An effective ETS should align with a nation’s unique realities and contribute to long-term decarbonization goals. Currently, as India’s ETS is in its infancy, no analytical studies have explored its potential benefits for India’s decarbonization strategy, sector-specific emission targets, or its interaction with existing policies. Our study aims to fill this knowledge gap by addressing three core questions: (i) what role can an ETS play in India’s goal of achieving net-zero CO2 emissions by 2070? (ii) How might the various sectors interact under an emissions cap? (iii) What are the interactions between the ETS and existing policies, such as RPOs?
The next section presents our scenario modelling approach, followed by presentation on results in the third section. We devote section 4 for discussions, including the limitations of the study, and present the conclusions in section 5.
2. Methodology and scenario framework
We use the integrated assessment model Global Change Analysis Model v 6.0 (GCAM 6.0) (GCAM 2023)—version to assess the effectiveness of an ETS and its synergy with RPOs. In our analysis, we adapt key parameters within the model to accurately reflect India-specific conditions and. These adjustments align with those in GCAM—, previously used for Indian net-zero scenarios (Chaturvedi and Malyan 2022). We employ this version due to the absence of industry sector disaggregation in the alternative model version. For details on GCAM’s modelling approach refer to SI section S2 and for changes to GCAM 6.0 done as part of this analysis, refer to SI section S3.
In GCAM v6.0, the industry sector is categorized into manufacturing and non-manufacturing sectors, further divided into nine sub-sectors (details in SI sections S2.1 and S2.2). This study focuses on a specific subset of these sectors, selected for their potential insights rather than a complete replication of an actual ETS. The first is the electricity sector, significant both for its emission contribution as well as the rapid advancements in its decarbonization technologies. The remaining three sectors, iron and steel, cement, and fertilizers, represent vital sectors from in industrial decarbonization. Together, these sectors encompass a balanced mix of relatively easier and more challenging emissions abatement scenarios, accounting for approximately 52% of India’s total GHG emissions (excluding LULUCF; in 2016) and 65% of energy-related emissions (Ministry of Environment, Forest and Climate Change, Government of India 2021). Our assessment solely addresses CO2 emissions, excluding other greenhouse gases from India’s energy sector.
Sectoral abatement cost is one of the key assumptions for modelling an ETS. We input a detailed suite of mitigation technologies across the ETS sectors. The cost assumptions for the three industrial sectors are based on IEA (2022), Ren et al (2021), as well as inputs from industry experts. Cost assumptions for mitigation technologies in the electricity generation sector are based on Chaturvedi and Malyan (2022). The cost assumptions for the ETS sectors are given in the SI section S3.2.
2.1. Scenario framework
To investigate the above-mentioned objectives, we construct a set of four main scenarios (#1, #2, #3, #4) and two scenario variants (#3.1, #3.2) as shown in table 1. A short description is given in the table while a detailed description is provided in the text below.
Table 1. Scenario names and descriptions used in the study.
| # | Scenario Name | Description |
|---|---|---|
| 1 | REF/NZ | Fulfils India’s 2030 NDC targets for GHG emissions and energy mix, implemented and announced energy policies, as well as net-zero target in 2070. |
| 2 | NZ+ ETS | From 2030, we assume additional emissions reduction in electricity, iron and steel, cement, and fertilizer sectors compared to Scenario 1, which gradually increase to 10% in 2040. After 2040, emissions in these sectors decrease to half their 2070 value in the NZ scenario, however overall economy-wide emissions go to zero. |
| 3 | NZ+ CC | As Scenario 2 (NZ+ ETS) except there is no trading across sectors. This more closely equates to a command-and-control type policy. |
| 3.1 | NZ+ CC_v1 | Variants of Scenario 3 (NZ+ CC) with same total annual emission caps across the four sectors but with different sectoral caps. |
| 3.2 | NZ+ CC_v2 | |
| 4 | NZ+ RPO+ ETS | As Scenario 2 (NZ+ ETS) except with the addition of renewable purchase obligations. |
The REF or NZ scenario aligns with the NDC’s core objectives, which involve: (i) decreasing GDP emissions intensity by 45% by 2030 compared to 2005 levels, and (ii) attaining 50% cumulative electricity capacity from non-fossil fuel sources by 2030 (Press Information Bureau 2022). This level of ambition extends to 2040, after which emissions linearly decline to zero by 2070, based on previous analysis by Chaturvedi and Malyan (2022). This implies that the model does not determine the time path of emissions based on cost-effectiveness, but offers a cost-effective solution for an exogenously given time path of emissions chosen by the policymaker. The peaking year is based on announcements by government representatives (Rajesh Kumar and Francine 2021) and expert opinions looking at the timing of peaking and net-zero target years of advanced economies and China, as well as the expected GDP growth trajectory of India, which would make early peaking very challenging (Jayashree 2021, Chaturvedi 2021). In the end, peaking and emissions decline will be a choice based on several considerations, including political ambition at the national level, the rate of technological deployment, and other socio-economic factors. While not prescribing any particular year, this study assumes 2040 as the peak year and 2070 as the NZ year.
We assume rising energy efficiency across sectors, meeting or surpassing PAT scheme targets in industry. Capital costs for solar, wind, and batteries decrease. Additionally, we assume that continued investments and policy-support for hydrogen leads to low hydrogen costs (refer to section S3 for changes to the model done as part of this study).
Table 1 outlines scenarios 2–4, building upon the reference/net-zero (REF/NZ) scenario. In the NZ + ETS scenario, a unified ETS cap is introduced for four sectors. This entails reducing total combined emissions across these sectors by 10% in 2040 compared to REF/NZ, starting with a gradual increase from 3% in 2030. Post 2040, emissions caps linearly decline, reaching 183 MtCO2 in 2070. Notably, we exclude RPO targets in the NZ + ETS scenario, although currently in effect, to assess their synergy with ETS, thereby creating a distinct scenario. Total emissions pathways are illustrated later in section 3.2 while sectoral-level pathways are shown in SI section S5.
The NZ + CC scenario is similar to Scenario 2 (NZ + ETS), except that there is no trading across ETS sectors. Its main purpose is to explore the cost-effectiveness of a trading vs. a no-trading scenario.
Two scenario variants, NZ + CC_V1 and NZ + CC_V2 additionally explore the sensitivity of cross-sectoral financial transfers due to a different underlying distribution of sectoral caps. The actual percentage reduction with respect to baseline (REF/NZ) is given in SI section S4.
In the NZ + RPO + ETS scenario, we introduce RPOs alongside the combined ETS for four sectors. This scenario examines how the RPO policy interacts with the ETS. RPOs are the chosen energy policy to study interaction with an ETS because it is one of the strictest energy policies in the country. Targets as part of the RPO are in terms of total electricity generation. Following Ministry of Power guidelines, RPO targets increase from 24.6% in 2023 to 43.3% in 2030 (Ministry of Power, Government of India 2022). We extend the targets linearly until 2040, reaching nearly 73% renewable electricity generation. Beyond 2040, no mandatory RPOs are assumed, as the high RE share requires no further policy support.
3. Results
3.1. Comparison of emission trajectories
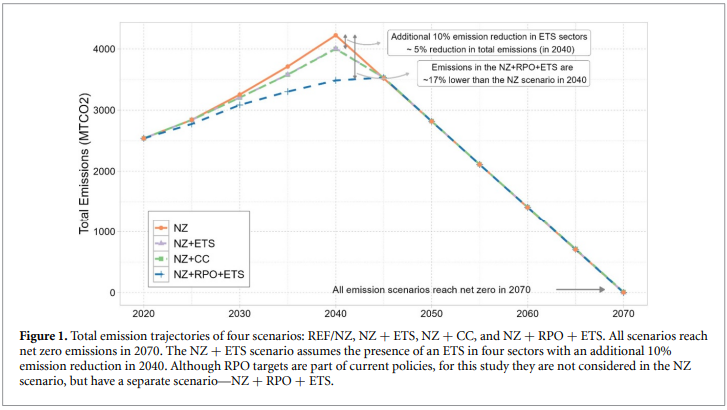
The emission trajectories of the REF/NZ scenario and NZ + ETS scenario are shown in figure 1. The NZ scenario reaches emissions peak in 2040 following currently implemented energy and climate policies (except the RPO). After 2040, emissions decrease linearly to zero in 2070. In the NZ + ETS scenario, we constraint the emissions from the ETS sectors such that in 2040, emissions from the ETS sectors are 10% lower than the NZ scenario, leading to ∼5% decline in overall emissions. The NZ+ RPO+ ETS considers the effect of both the RPO and the ETS and leads to a∼15% reduction in total emissions. This scenario is explained in more detail in section 3.4.
3.2. Reference scenario
3.2.1. Socioeconomic and demand trends
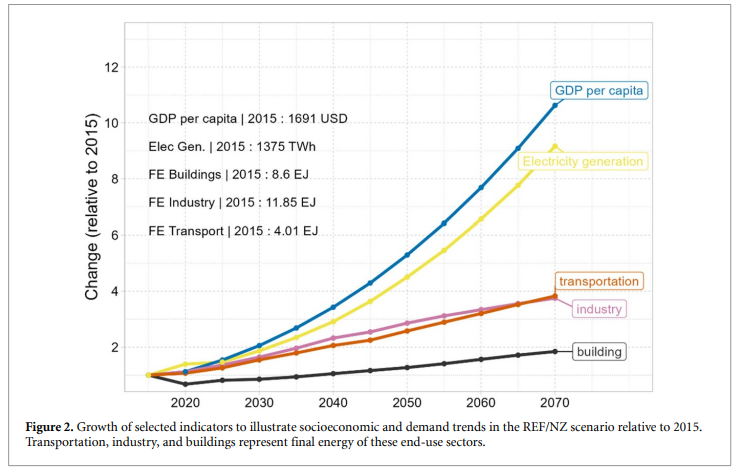
In our REF/NZ scenario, the Indian economy experiences rapid growth, with per capita income in 2015 at approximately $2000, increasing by 5x in 2050 and 11x in 2070 (see table S2 for growth rate details; GDP is nominal). This robust economic expansion drives increasing demand for industrial commodities like iron and steel, cement, and aluminium, as well as in end-use sectors such as buildings and transportation, notably impacting electricity generation (figures 2 and 3). Both transportation and industry sectors exhibit similar energy demand growth rates, while building sector growth is about half as much. The industry sector, currently constituting nearly 50% of final energy demand, maintains its leading role in future energy consumption.
3.2.2. Emission trends and production structure of the considered sectors in the REF/NZ scenario
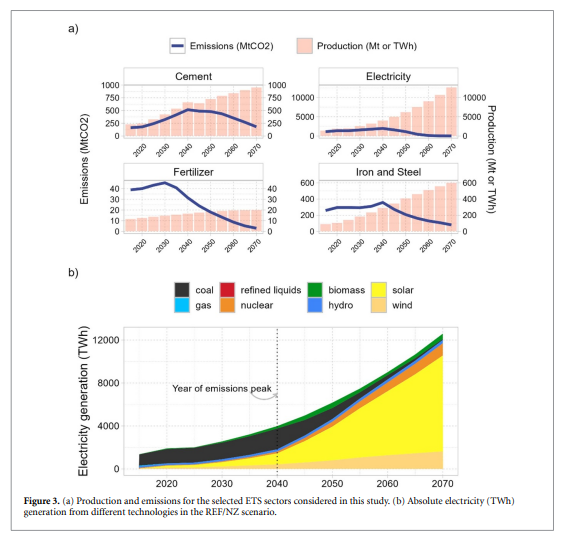
In the electricity sector, most of the additional demand for electricity is met through variable renewable energy sources, particularly solar, driven by lowering capital costs, supportive policies, and manageable intermittency costs. However, in the absence of policies targeting coal generation, conventional coal power plants continue expanding until 2040, resulting in increased sector emissions (figure 3(a)). Consequently, by 2040, nearly 36% of electricity generation stems from solar and wind, compared to the current 10%, while coal-based generation drops from 68% in 2020 to 48% in 2040 (figure 3(b)).
As mentioned in section 2.2, starting in 2040, we assume a substantial drop in economy-wide emissions on the path to net-zero by 2070. This generates an endogenously calculated carbon price in the model, prompting emission cuts across all sectors. In the electricity sector, where reductions are cost-effective, solar PV expands significantly, along with modest increases in biomass-based electricity and more efficient coal plants. By 2060, the electricity system is nearly fully decarbonized, mainly powered by solar, with smaller inputs from wind, nuclear, and biomass (see figure 3(b)).
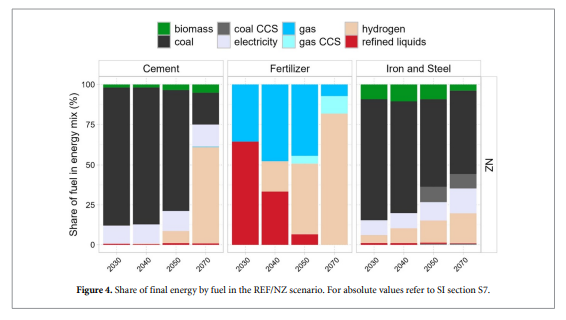
Beyond electricity, demand for other materials like iron and steel, cement, and fertilizer also increases, driving emissions growth in these sectors (figure 3(a)). Emissions from the fertilizer sector peak in 2030, while the rest reach their peak in 2040, aligned with the overall economy. Post-2040, due to an economy-wide emissions constraint, a combination of fuel-switching, increased electrification, CCS implementation, and hydrogen use drives industrial decarbonization (figure 4). Apart from the electricity sector, emissions in the other sectors do not fall to zero in 2070 (see SI section S5—both iron and steel and cement sectors still use unabated coal). Total emissions from these two sectors are ∼265 MtCO2 in 2070. Emissions in these hard-to-abate sectors are offset by negative emissions, principally in the agriculture, forestry, and other land use sector, achieving net-zero emissions by 2070.
3.3. Cost-effectiveness of an ETS
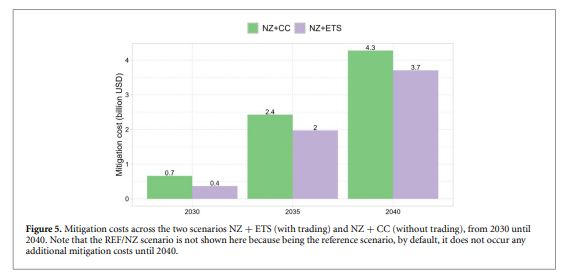
To demonstrate the cost-effectiveness of an ETS, we compare the mitigation costs of a NZ+ ETS scenario with a NZ + CC scenario, where emission trading is not permitted but the same total emissions reduction is achieved (figure 5). In an ETS, sectors like cement can choose to reduce emissions or purchase cheaper emission permits. In a CC-type policy, sectors can only achieve emission reductions through in-house methods, limiting flexibility and potentially increasing costs. On average, mitigation costs of the scenario with trading are 24% lower than the scenario without trading.
3.4. Role of the electricity sector in an ETS
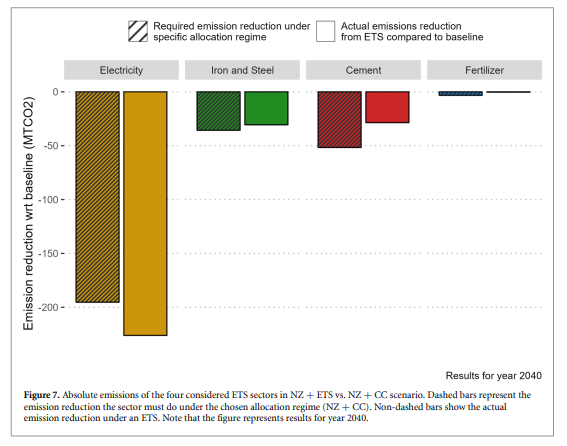
In an ETS with an emissions cap, the electricity sector leads in emission reduction both due to cost-effective mitigation options in the form of renewable energy and significant potential for absolute emission reduction. Figure 7 shows that (in 2040), electricity sectors contribute most to the (reductions) in emissions cap—79% in the electricity sector, followed by 11% in the iron and steel sector and 10% in the cement sector with the fertilizer sector doing almost no emission reduction.
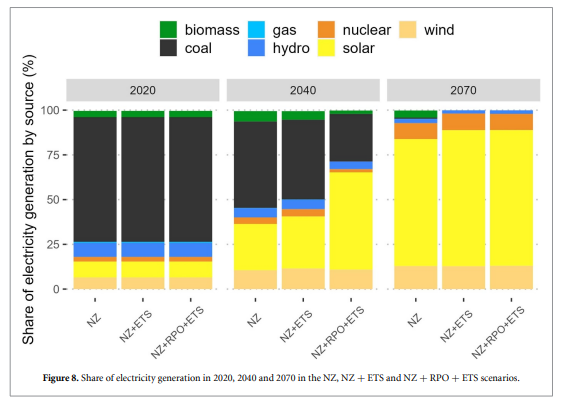
Emission reductions in the electricity sector occur through a combination of factors driven by the ETS. The ETS introduces a carbon price that raises operating costs for fossil fuel-based power plants, especially coal, due to increased fuel prices. This prompts these plants to lower their plant load factors (see SI section S8 for generation costs by fuel). While coal generation becomes less economically viable in the ETS, the costs of alternative fuels like biomass and gas remain relatively high, hindering their adoption as replacements. Figure 8 shows the share of different power generation sources in the reference, trading, and trading with RPO scenarios (NZ, NZ + ETS, NZ + RPO + ETS). The share of solar in the three scenarios is 26%, 29%, and 54% respectively in 2040 while wind is 10.5%, 11.5%, and 11% respectively. While an ETS, with the given emissions cap, is successful in increasing the share of renewable energy in the power sector, the shares are still far from the RE targets required by the RPO (48% in NZ+ ETS vs. 73% in RPO). As a result, there is a significant difference in shares of renewable energy, particularly solar PV, between the NZ + ETS and NZ+ RPO+ ETS scenarios.
While the electricity sector emerges as the principal source of emission reductions, which sector would sell or buy emission permits in an ETS depends on the sectoral allocation and ETS compliance strategies of individual entities. In the allocation assumed in the NZ + CC scenario (all ETS sectors must do the same percentage emission reduction) and shown as dashed bars in figure 7, the electricity sector would sell permits while the iron and steel, cement and fertilizer sectors would buy these permits. The financial implications from different allocation regimes is explored in section 3.6.
Note that unlike between 2030 and 2040, where we assume an ETS cap with respect to the baseline for the four sectors (leading to a 10% reduction in combined emissions in 2040), for the years after 2040, we assume that the sectors collectively follow a linear path and reach 183 MtCO2 in 2070. Refer to SI section S5 for emission trajectories of the ETS sectors and their explanation (after 2040) and SI section S6 for decarbonization in industrial sectors within the ETS.
3.5. ETS with other energy policies: effect of an RPO
The role of complementary policies is critical in the larger decarbonization strategy for any country. India also has a number of policies across sectors and the ETS will interact with many of these especially when there are common sectors involved. We explore here the implication of interaction effect of ETS with RPOs. While an ETS increases costs of fossil and encourages fuel switching, RPOs promote renewables’ deployment. India’s RPO mandates are among its strictest climate policies. The most recent update requires nearly 43% renewable electricity generation by 2030, progressively reaching 73% by 2040, with no assumed targets beyond that year.
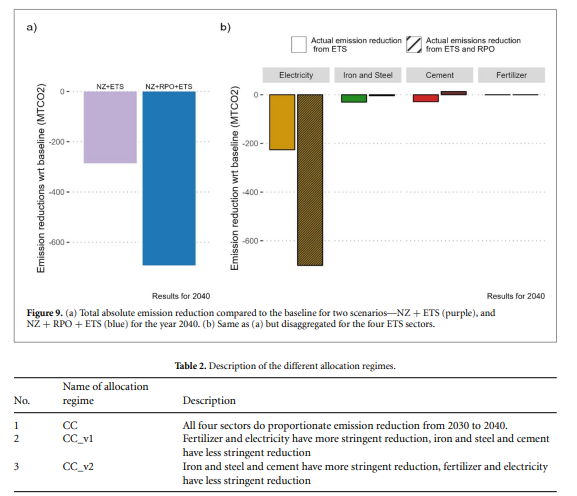
Emission reductions in the RPO take place through scaling up of renewable energy share only in the power sector. On the other hand, emission reductions in the ETS take place in the sector where it is cheapest first. As we saw in earlier in section 3.4, most but not all of these reductions take place in the power sector, as it is where emission reductions are the cheapest. Relative to the baseline, in 2040, the total emission reductions from the RPO (−690 MtCO2) are more than 50% higher than the emission reduction in the ETS scenario (−287MtCO2, see figure 9(a)). Thus, in this particular combination of ETS and RPO targets, the ETS does not lead to any additional emission reductions.
At a sector level, figure 9(b) shows that all emission reductions in the RPO scenario happen only in the electricity sector (dashed bars). In comparison, in the NZ+ ETS sectors, other sectors also contribute to emission reduction (non-dashed bars). In effect, this implies that the price of carbon will be near zero in the NZ+ RPO+ ETS scenario, because the stringent RPO makes the ETS emission-cap constraint non-binding, such that the associated price of carbon goes to zero.
The relative stringency of policies hence would have significant implications for the supply-demand dynamics of the ETS as well as its carbon price.
3.6. Cross-sectoral financial transfers under different allocation regimes
In the initial stages of an ETS, the regulator may establish sector-specific emission intensity targets or allocate free emission allowances to certain sectors or entities to ease the transition to a carbon-constrained economy. Additionally, it aids sectors most vulnerable to increase in production sectors or those with international competitiveness concerns. To study the impact of various sector-specific targets on financial transfers, we introduce scenario variants with distinct allocation approaches (see table 2). It is important to note that the overall ETS cap remains consistent across all scenarios.
Figure 10 shows that the allocation regimes affect both the direction and quantity of financial transfers. Specifically, in the CC_V1 scenario, the electricity sector is subject to stringent emissions targets, resulting in a need to purchase permits from other sectors in the next decade, primarily the iron and steel sector. However, generally, the electricity sector is a net-seller of the emission allowances, whereas the other three ETS sectors are the net-buyers. The precise amount of these transfers changes across the different allocation regimes.
4. Discussion and implications
Several insights emerge from the results. First, in section 3.3, we showed that an ETS is more cost-effective than equivalent command-and-control policies that do not allow trading across sectors. The magnitude of the cost-effectiveness depends on the allocation targets set for the regulated sectors but potentially also on other factors like the magnitude of the overall cap and the number of sectors covered and their characteristics. Understanding the economic efficiency of a trading-based regulation is important because policymakers might instead consider setting up specific emission regulations for their industries because of reasons of administrative practicality (i.e. lower transaction costs) rather than setting up a functioning ETS that requires a much higher level of coordination across sectors to administer the trading platform.
Second, we showed that the electricity sector plays a critical role in an ETS because of its potential to provide large amounts of cost-effective emission reduction options. These mainly include new solar and wind installations that outcompete coal-based generation, with the latter getting progressively more expensive following the discovery of a carbon price. This phenomenon is unlike the electricity sectors in the US and EU, where the availability of cheap gas initially displaced coal generation. The quantity of emission reduction permits the electricity sector to supply will depend on electricity demand and sector-specific targets. For example, a stringent ETS cap combined with low electricity demand would imply limited potential for adding RE in the grid and, hence, a lower supply of emission reduction permits. However, in a high-growth economy like India, only negative economic growth would imply a lower electricity demand growth trajectory. There is a high likelihood that the electricity sector will continue to supply significant credits unless its sector-specific target is very stringent, as shown in section 3.7.
Third, the energy policy in the form of an RPO interacts with the ETS through the electricity sector, which is covered by both policy instruments. Specifically, we showed that the relative stringency between the RPO and the ETS is critical to the success of both these policies. Given the assumptions of this study, the emission reductions required by the ETS up to 2040 can be entirely fulfilled by the electricity sector since RPOs mandate these reductions. In reality, there would be an oversupply of emission permits in the market, which, in turn, would push down carbon prices. Consequently, low carbon prices disincentivize the industry from implementing in-house mitigation technologies. Past studies have shown that an ETS, coupled with a high feed-in tariff for RE or other renewable support policies, could suppress the carbon price, as these policies would make it much easier for the electricity sector to reduce emissions. At the same time, these policies are important for achieving other policy objectives—for example, creating sufficient demand for renewable energy. As such, ETS cap-setting needs to consider what emission reductions will be delivered by other policies, including renewable support policies, to avoid being insufficiently ambitious and not driving enough low-carbon action.
Fourth, we showed that the direction and magnitude of financial transfers across sectors in an ETS depend on the allocation of sectoral targets by the government or the regulator. The electricity sector, for example, could become a net seller in the near term if stringent targets are set for it. The setting up of allocation targets is a lengthy process involving extensive consultations and negotiations with industry representatives, including which allocation methodology to use. Although setting targets has several benefits in the initial phase of implementing an ETS, such as providing clear signaling for industries and assisting those most at risk of carbon leakage through less stringent emission targets, in the longer term, auctioning should be the preferred choice of emission allocation as it efficiently allocates emission caps across sectors and additionally generates revenue for the government.
5. Conclusions and future work
In the context of India’s near-term and long-term decarbonization objectives, the country has announced the introduction of a domestic ETS. The ETS, based on emissions intensity targets, is aimed at reducing emissions and spurring low-carbon innovation especially in the industry sector. In this study, we ran four scenarios (NZ, NZ + ETS, NZ + CC, NZ + RPO + ETS) and two scenario variants (NZ + CC_v1, NZ + CC_v2), using the integrated assessment model GCAM, to understand the role of the ETS in its net-zero target, the interaction between various industrial sectors in an ETS, and the interaction of an ETS with energy policies, specifically RPOs.
The study’s findings highlight several key points. Firstly, the electricity sector plays a vital role in an ETS, not only due to its potential for affordable emission credits but also because of its interaction with the ETS through RPOs. Secondly, different industrial sectors vary in their decarbonization capabilities, depending on their individual characteristics. Sectors relying on fossil fuels or carbon-compounds as raw materials (such as natural gas based steam reforming in fertilizers or limestone in cement) face challenges due to unavailable or costly substitutes—making decarbonization expensive. Thirdly, ETS enables the utilization of cost-effective opportunities, enhancing overall cost-effectiveness compared to non-trading policies. Lastly, for ETS success, interactions with other energy policies are critical. Specifically, the influence of stringent policies like RPOs should be considered when setting ETS reduction targets to prevent adverse effects, such as carbon price suppression.
This first-of-a-kind study has provided insights into India’s ETS’s key design considerations. However, several additional questions, based on the methodology developed in the paper, can be investigated. These include exploring interaction effects with policies in non-ETS sectors such as transportation, investigating how the addition or removal of sectors impacts carbon prices in an ETS, understanding ETS effectiveness at different growth rates of electricity demand, and exploring the effect of a range of emission caps on the main insights of the paper. Lastly, energy transition through carbon pricing will not only directly impact emission-intensive sectors but also consumers through the prices of energy and related commodities. Therefore, the feasibility of scenarios, through both a technical as well as equity lens need to be explored. This will require both modeling and non-modeling approaches, beyond those which have been covered in this paper.
Source link: View article